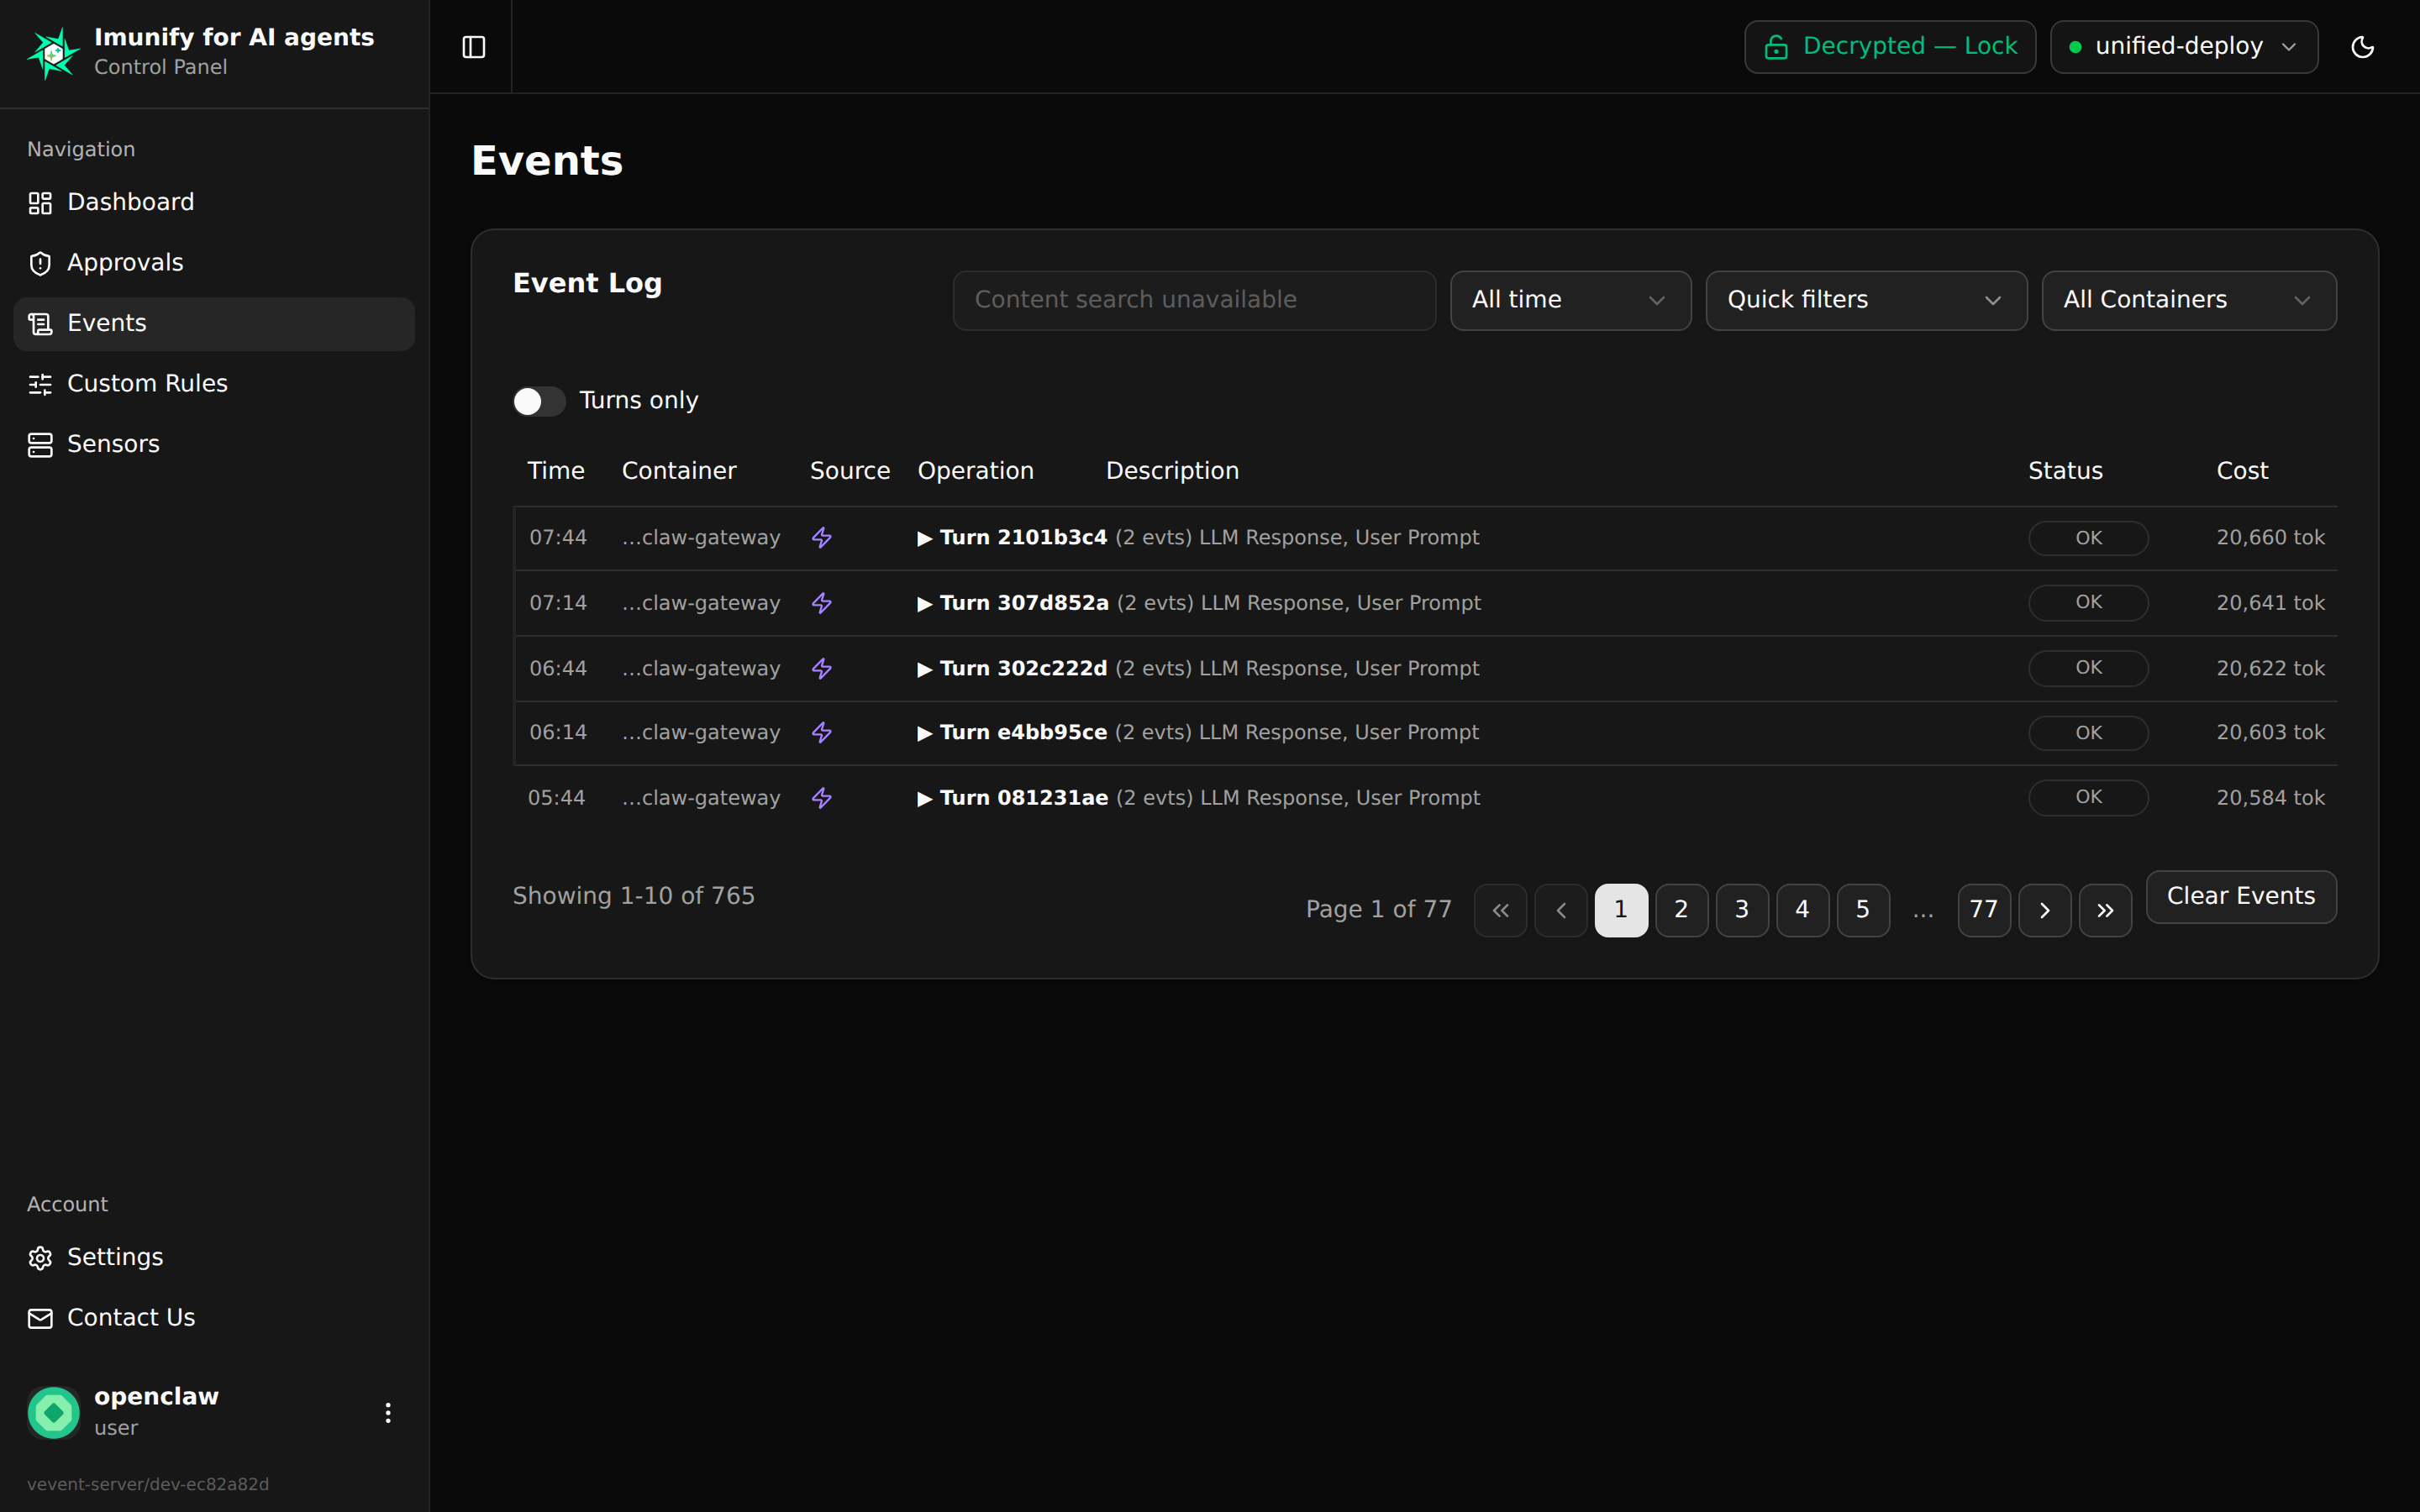
The Events page is the audit log of everything your sensors flagged: which system call or tool call happened, on which host, what the policy decided, and which rule decided it. Where the Approvals page is about decisions you need to make now, Events is the record of what already happened — both the things that were blocked or held and the routine activity worth keeping.
What one row tells you#
Each row is one thing a monitored process did. The columns are:
- Time — when the sensor observed it.
- Type — the kind of activity: a system call (
OPENAT,EXECVE,CONNECT, …), a network or HTTP event, or an AI-agent tool call. - Target — what it acted on: a file path, an
ip:port, a URL, or the tool/command. Encrypted content (see below) shows here once you unlock. - Rule — the human-readable name of the rule that fired (hover for the raw rule ID).
- Status — the decision badge: Allowed, Warn, Blocked, Held (for approval), Killed, or Timeout.
Click any row to open the detail sheet with the full context the sensor captured: the process (PID, executable), the matched rule, the container name if the activity came from inside one, and the decrypted content fields.
The Status badge does more than label#
On actionable rows — anything blocked, killed, or held — the decision badge carries a small caret (▾). It opens a menu that lets you turn this one event into a persistent custom rule without hand-writing anything:
- Whitelist — always allow activity like this from now on.
- Require approval — stop auto-blocking and ask you instead (block rows only).
Choosing either opens a short dialog where you can record why (optional, up to 2000 characters) before confirming. The new rule then appears on the Custom Rules page in the sidebar, where you can change its action (allow / approve / deny) or remove it later. Routine allow/warn rows and group_* analysis rows have no caret.
A small pencil icon inside a badge means the event matched a rule you created or overrode — “modified by rule.” Hover it for the tooltip.
Filtering the log#
The toolbar narrows the log down. The filters that matter most day to day:
- Decision —
BLOCK,WARN,HOLD,KILL,TIMEOUT(combinable, e.g. show only blocks and kills). - Category —
SYSCALL,NETWORK,FILE,PROCESS,HTTP. - Risk level —
LOW,MEDIUM,HIGH,CRITICAL. - Rule — every event that fired a specific rule.
- Time range — a start/end window.
- Sensor — set globally by the header sensor selector; every page, including Events, is scoped to it.
Two toggles control noise rather than narrowing by attribute:
- Exclude noise — hides classes of expected, low-signal activity (font/favicon/CDN fetches, reads the agent makes on itself, and similar) so the genuinely interesting rows stand out.
- Collapse duplicates (on by default) — when the same action is seen by more than one interception mechanism at once, it shows as a single row that lists the mechanisms that contributed, instead of two near-identical rows. Turn it off for a raw, forensic view that preserves every underlying record.
Turn grouping for AI agents#
When the activity comes from an AI agent, related events are linked by a turn — one step of the agent’s reasoning loop (read a file, run a command, make a request). The log groups them so you can expand a turn and see everything the agent did in that step together, instead of reading interleaved rows. This is what makes a multi-step attack — read a credential, then connect out, then exfiltrate — visible as one story rather than three unrelated lines.
Encrypted content and the unlock prompt#
Event content — paths, command arguments, executable paths, request and response bodies — is stored encrypted under a key only you control. The first time you open Events (or Approvals) after signing in, the Panel asks for your password to unlock that key for the session; the unlock lasts about fifteen minutes.
While the key is locked, the Event Log shows an Unlock data prompt instead of a blank or spinning panel — click it (or the lock indicator in the header) and enter your password to reveal the content. Two row states are expected:
- Redacted — what an administrator sees when looking at your events. Operational fields (sensor, time, decision, container) stay visible; your workload content does not.
- Unreadable after key reset — the row was encrypted under a key generation that a password reset destroyed. It stays in the audit trail but its content cannot be recovered.
See Encryption — User view for the full picture, and the Approvals page for resolving the events that are held for a decision.