The Imunify Panel is your day-to-day control plane. This page is a quick orientation so you know where to look the first time you sign in. The deeper Panel reference lives in the Panel section.
Signing in#
There is no self-service registration — your administrator creates your account up front and shares your username and a starting password with you. Open the Panel URL, sign in with those credentials, and your browser will offer to save the password as usual.
The Panel uses short-lived sign-in sessions. After about fifteen minutes of inactivity, it asks you to sign in again. This is intentional: it keeps a stolen browser tab from being useful to someone who is not you.
If you forget your password, an administrator can reset it. Note: resetting your password also resets your private content key, which means older encrypted events become unreadable. See Your first event for the details.
The sensor selector#
If you have more than one sensor — for example, one per server — the header has a sensor selector dropdown. Pick the sensor you want to look at and the Dashboard, Events, and Approvals pages all narrow their view to that sensor.
The Panel remembers your last choice in the browser, so the next time you sign in on the same computer you land on the same sensor.
If you do not have any sensors registered yet, the selector shows an Add Sensor button instead. Clicking it opens a small dialog that asks for a label (optional), then gives you a one-line install command to run on your next server. The command works the same way as the install token in Install the sensor.
Language#
The Panel ships in English by default and also supports German, French, Spanish, and Portuguese. Change the language from Settings → Language. Your choice is saved in the browser, so each computer you sign in from can have its own language.
Your first time on the Dashboard#
The Dashboard is the first page you land on after signing in. The four summary tiles across the top show Sensors, Events, Pending approvals, and active Overrides for the sensor you have selected. Below those, two charts show the recent event volume so you can spot bursts of activity.
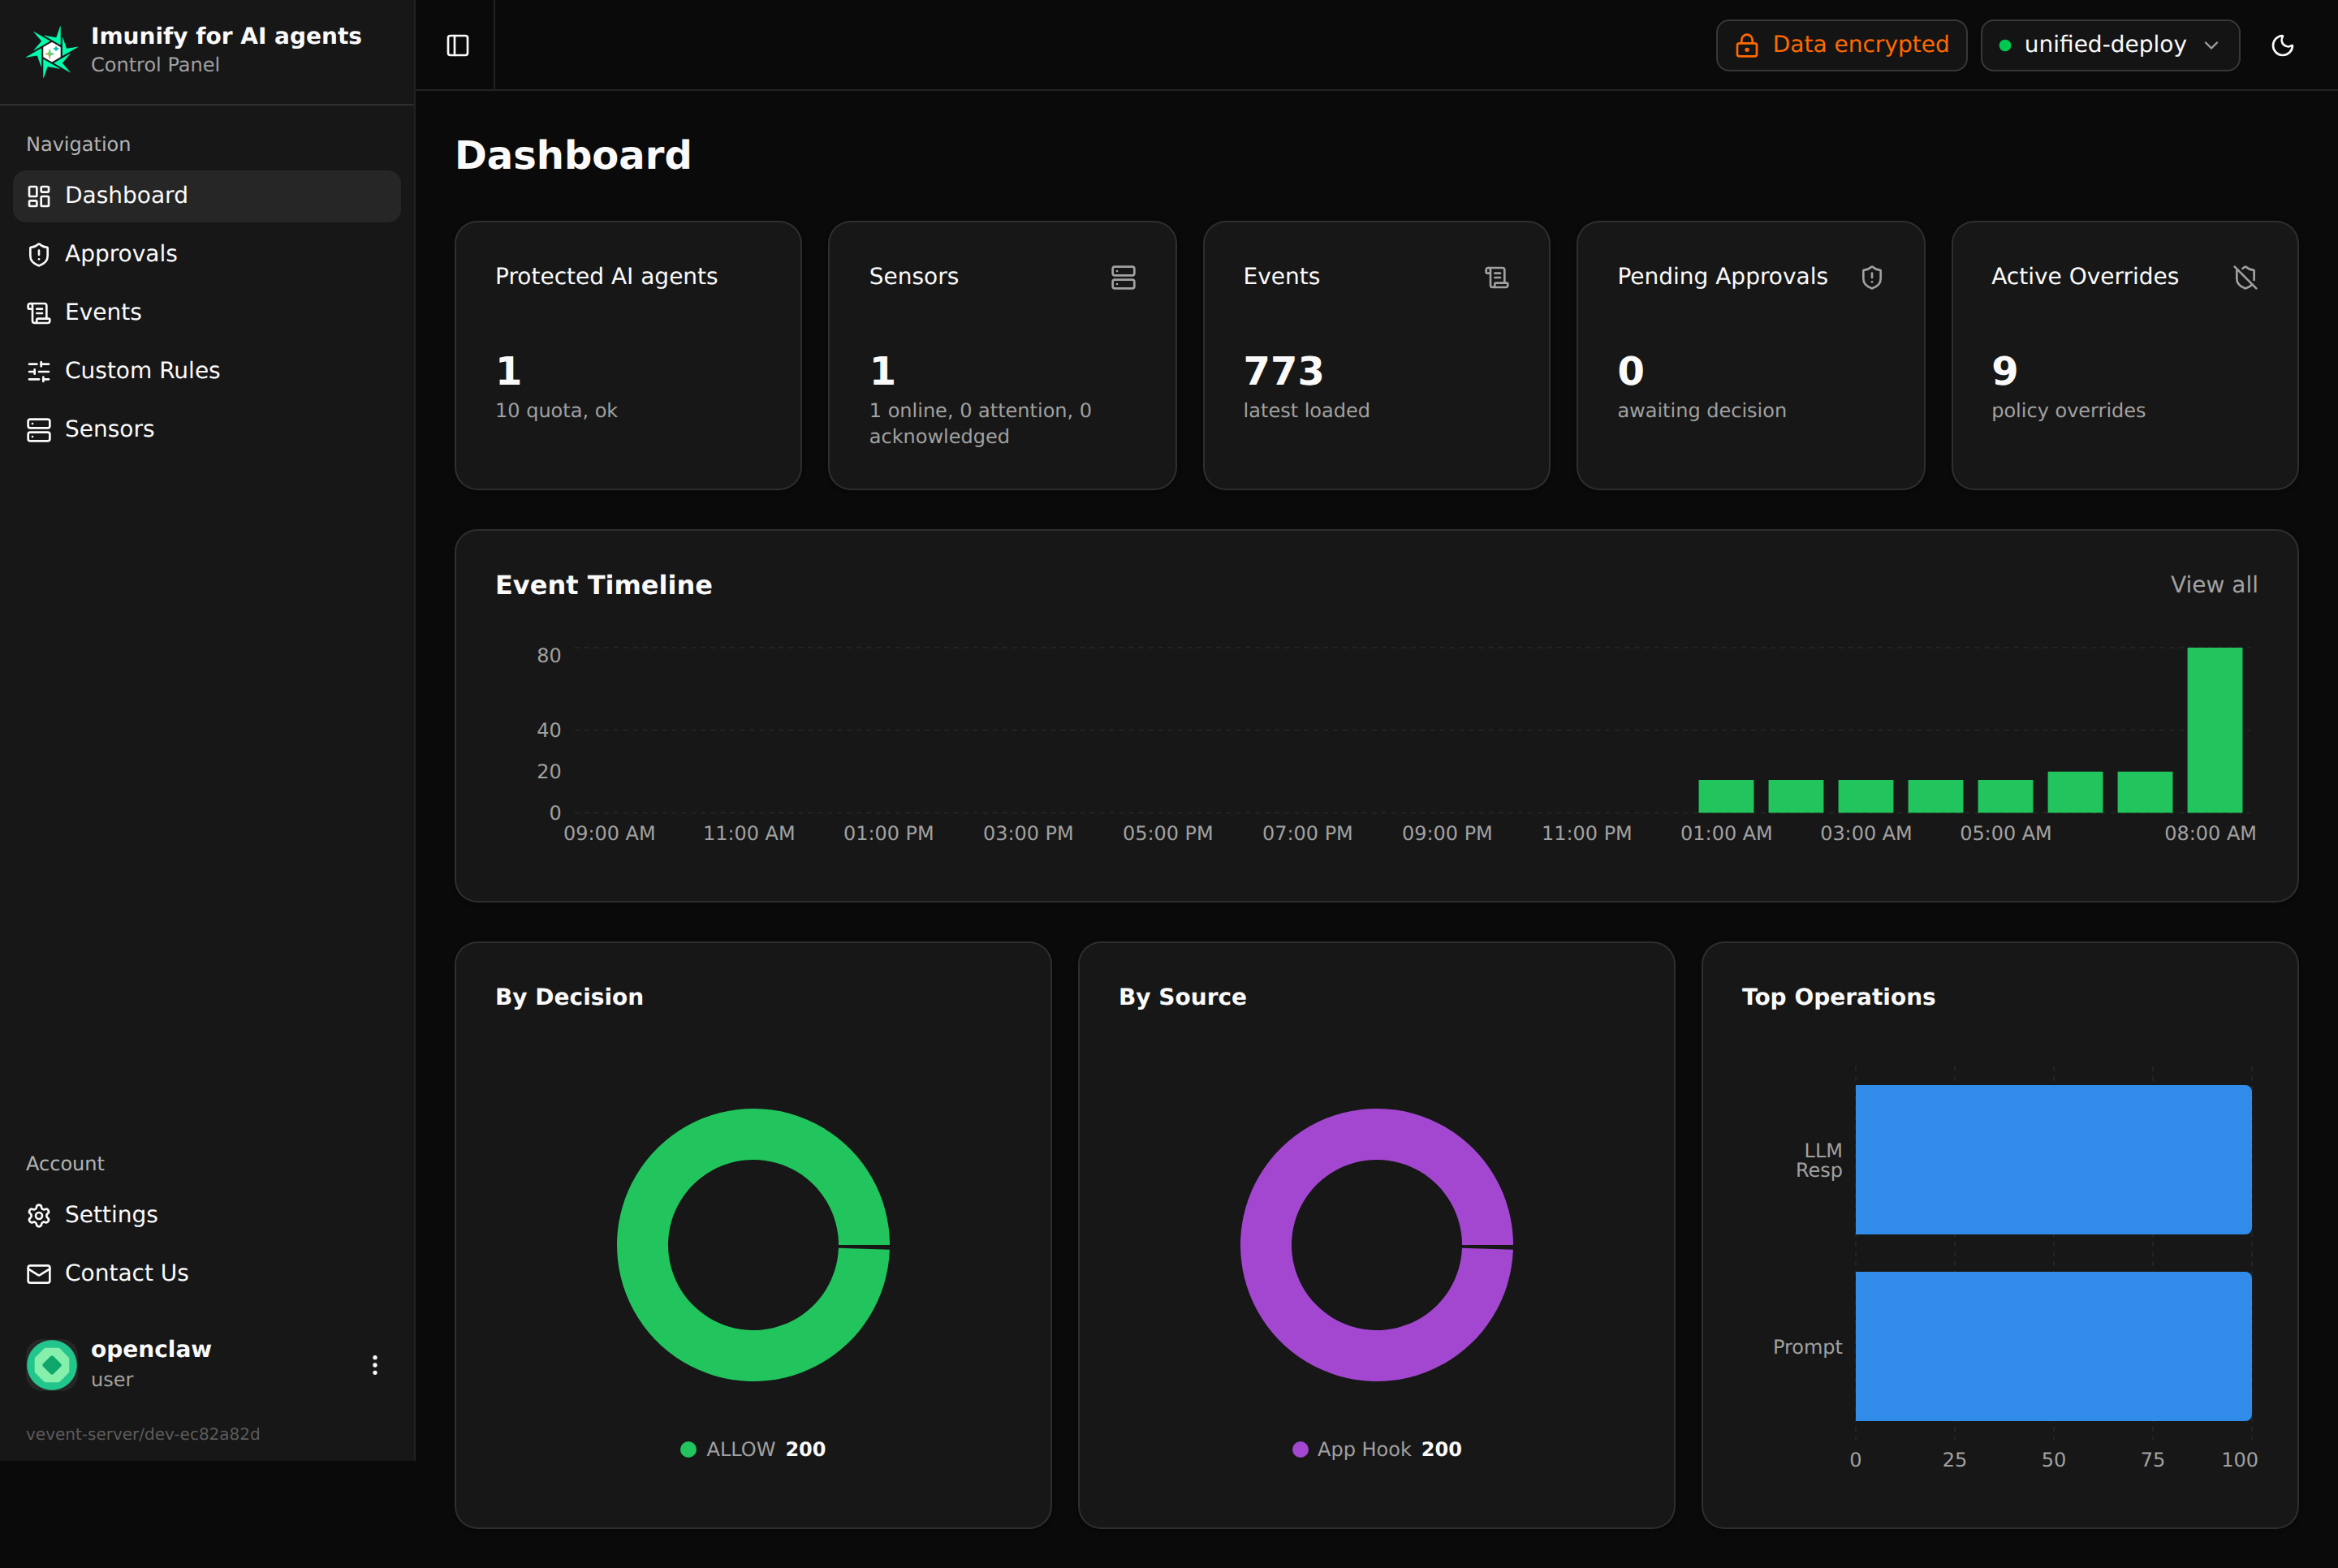
The first time you sign in, those numbers are probably zero or close to it. As your sensor starts intercepting system calls, the Events tile climbs and the chart fills in. The page keeps itself fresh in the background, so you do not need to refresh — if the live connection drops, an amber banner appears so you know the numbers are stale.
From here, the sidebar takes you to:
- Sensors — every server you have installed the sensor on, with its current status and capability pills.
- Events — the full filterable event log.
- Approvals — pending approvals and the history of past decisions.
- Overrides — active “always allow / always deny” rules you have set.
- Settings — your account, password, language, and notification channels.
The full reference for each of these pages lives in the Panel section.