Once your sensor is running, it uses kernel-level mechanisms (eBPF, fanotify, and seccomp) to watch which system calls the AI agent makes and which files it accesses — and, when the optional HTTP(S) proxy is enabled, the network requests it sends. The first time something risky happens, you see an event in the Panel — and possibly an approval prompt asking you to allow or deny it.
What the sensor watches#
Through those kernel mechanisms the sensor sees the operations that matter most for security:
- File reads (
openat) — reading sensitive files like SSH keys, credentials, and configuration. - Process execution (
execve) — running commands likesudo, package managers, or a new shell. - Network connections (
connect) — outbound connections to restricted destinations such as cloud metadata endpoints or internal networks. - File deletion (
unlinkat) — removing critical system files.
Every intercepted call is checked against your policy rules. Depending on the matching rule, the call is allowed (let through), blocked (denied at the kernel), or held for approval (paused while you decide).
What you should see in the Panel#
Open the Panel in your browser, sign in, and unlock your private content key when prompted. Then:
- Go to the Sensors page. Your newly installed sensor appears here. The status pill should be green and the LSM BPF, fanotify, and seccomp-notify capability pills should all be green within a heartbeat or two.
- Go to Events. As soon as a monitored process makes a watched system call, a row appears here with the syscall name, the path or destination, and the matching rule.
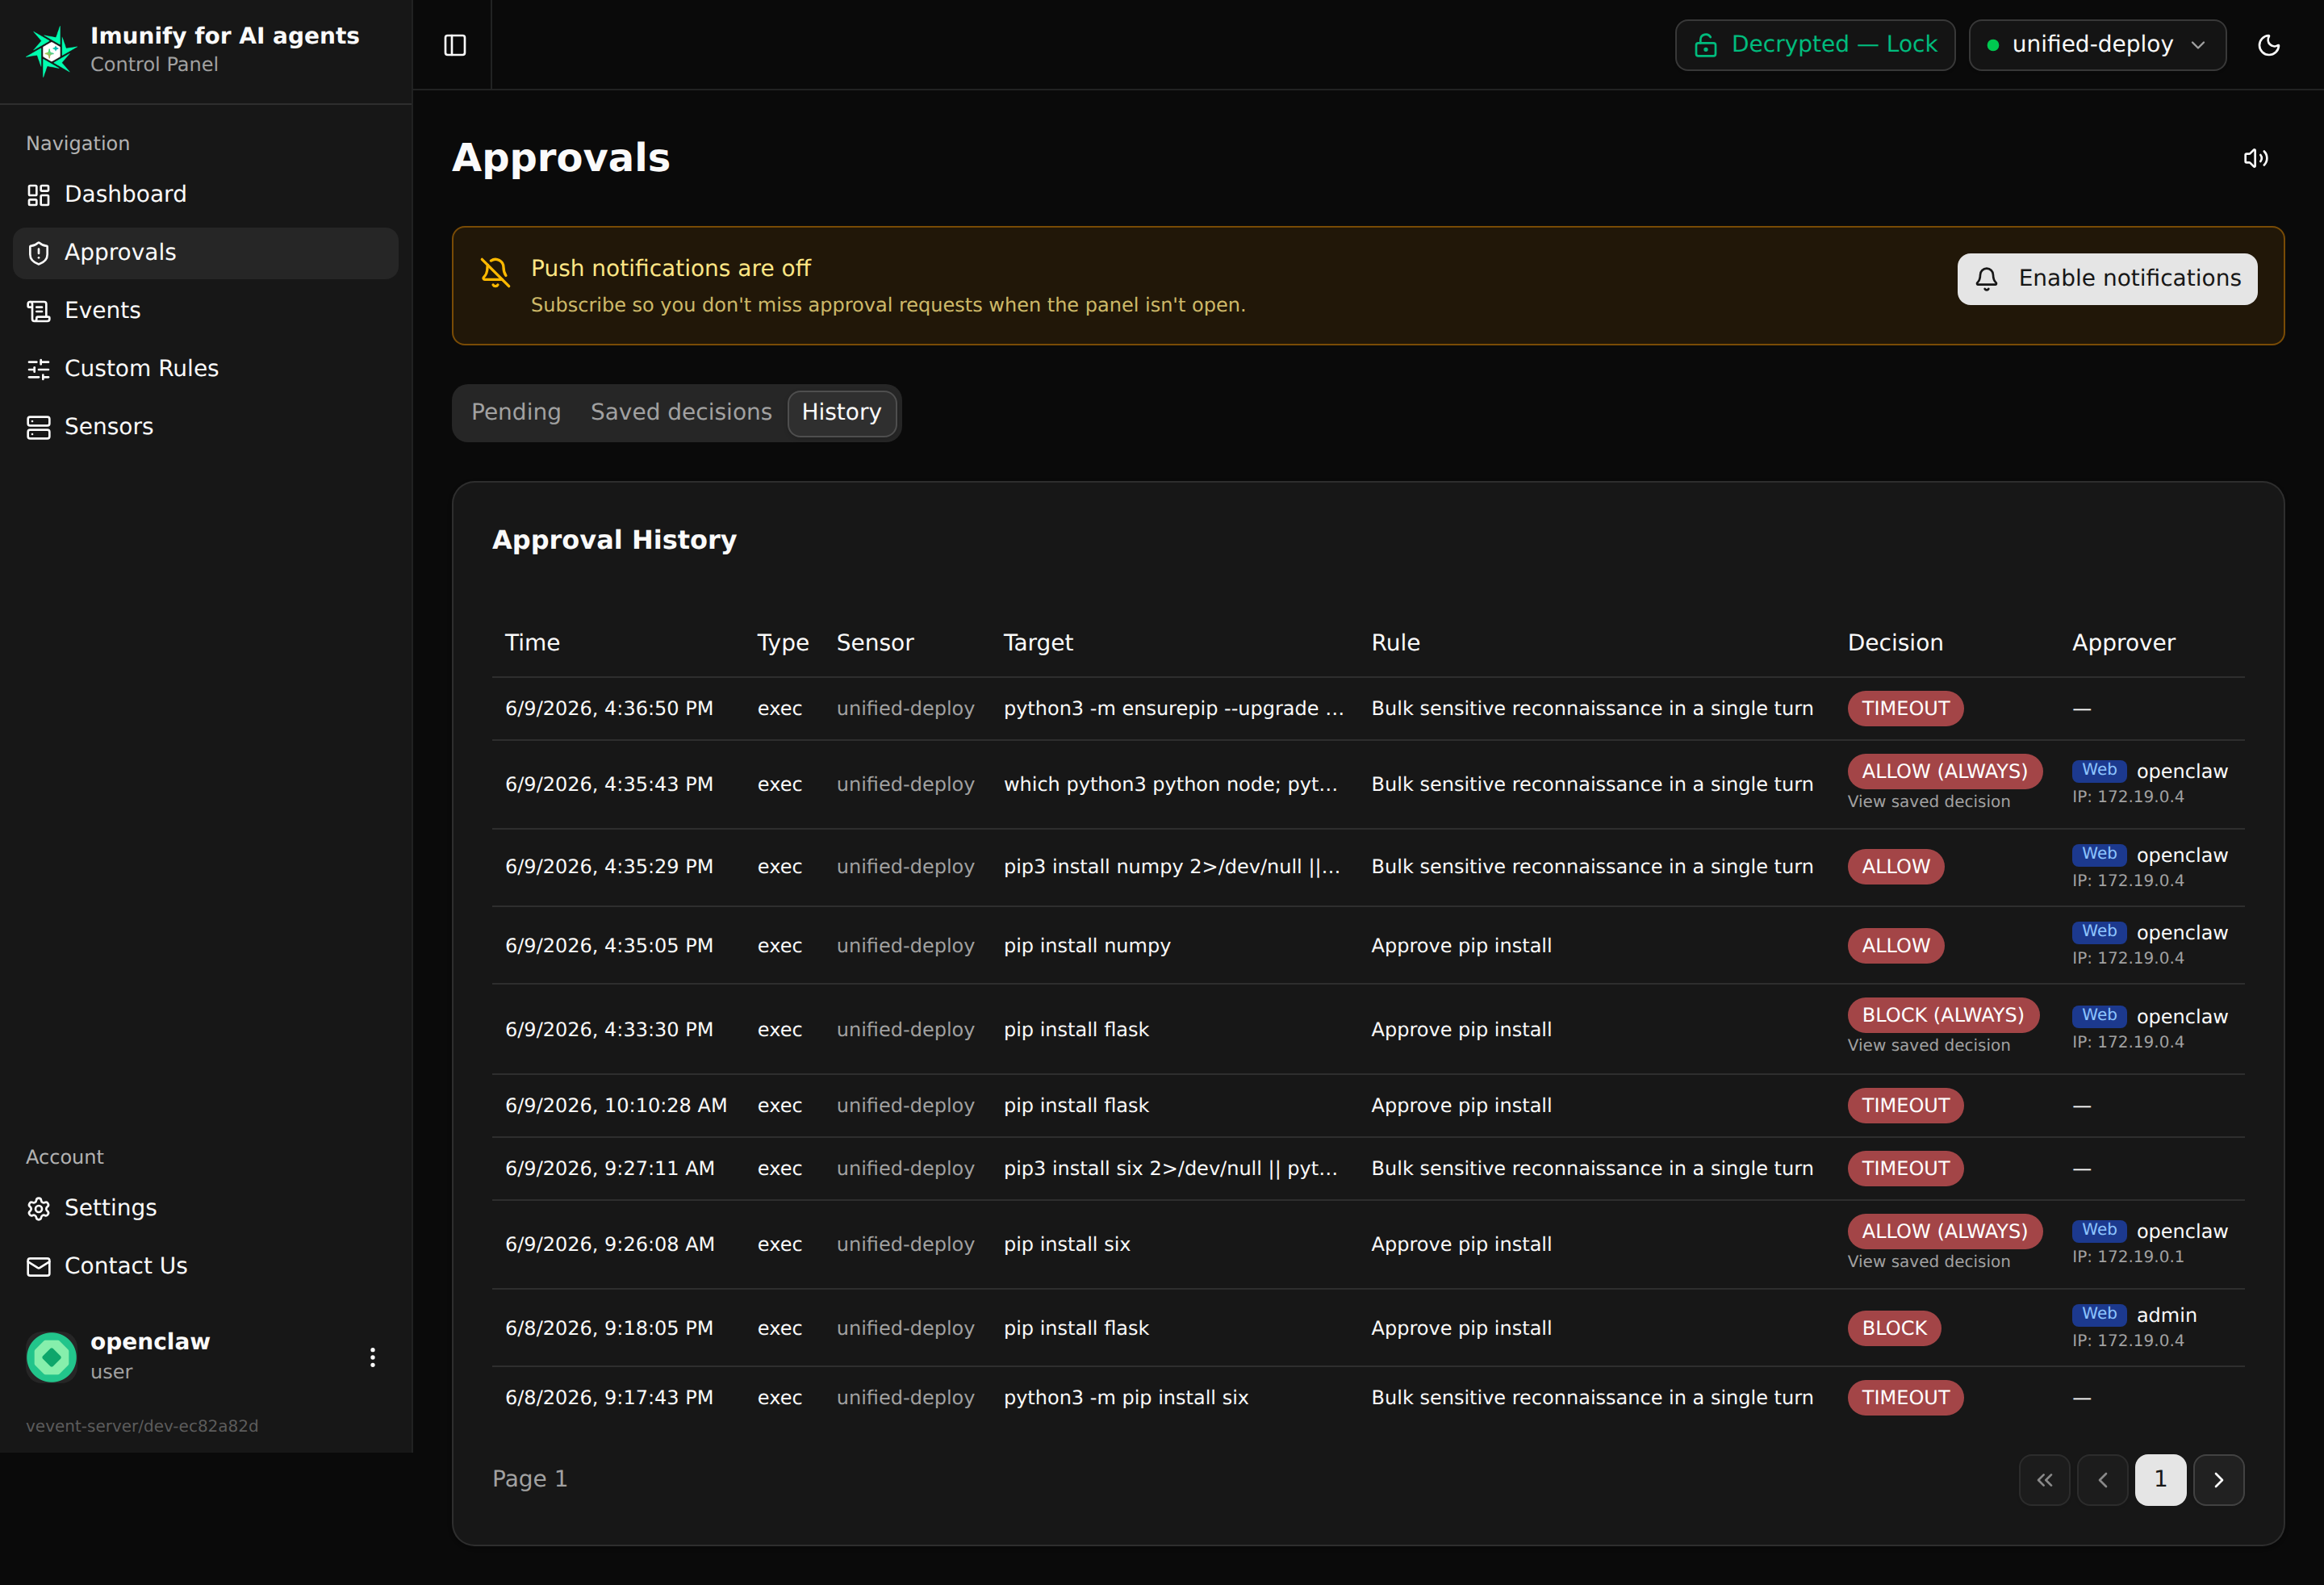
- Go to Approvals. If a rule is set to “hold for approval,” a card appears here with Allow Once, Allow Always, Deny Once, and Deny Always buttons. Approval requests also stream to Telegram or Discord if you linked one.
If nothing shows up after a few minutes, your sensor is connected but the watched processes have not done anything interesting yet. That is the expected steady state — the sensor only logs the events your rules tell it to log.
Reading your encrypted event content#
Your event and approval content — file paths, command arguments, executable paths, request and response bodies — is encrypted on the way in under a key only you control. The Panel decrypts it for you transparently, but two things look different from a plain dashboard:
You unlock once per sign-in. Right after you sign in, the Panel asks for your password a second time so it can unlock your private key. The unlock lasts about fifteen minutes and then the Panel asks again. This is intentional: someone with a stolen browser tab but no password cannot read your event content.
Lost password = lost data. Your password is the only thing that can unwrap your key. If you forget it and have to reset it, the previous key is destroyed and a fresh one is created. Older events stay in the database but show up as redacted with the reason
key_reset, and they cannot be recovered. Pick a password you can remember, or store it in your password manager.
Container and Docker names stay visible to administrators as operational metadata so they can tell replicas apart, but the content fields are unreadable to anyone but you.
A note on API tokens#
The unlock behavior is tied to your Panel sign-in session. Long-lived API tokens — the ones that look like sk-user-EXAMPLE — cannot unlock encrypted content. If your automation calls an event or approval content endpoint with one of those tokens, the API returns 403 requires_jwt. Use the Panel for encrypted content; use API tokens for redacted and metadata workflows. The full token reference is in your Panel’s authenticated API documentation (Settings → API documentation).
The Settings page also has a destructive Reset encryption key action. It requires typing your username and password before it runs and should only be used if you accept losing access to your older encrypted events.
Managing your sensor day to day#
You will rarely need to touch the sensor by hand once it is running, but a few systemctl and journalctl commands cover almost every situation:
Check the sensor’s status:
systemctl status imunifyai-sensor
View the most recent logs:
journalctl -u imunifyai-sensor --since "10 min ago" --no-pager
Restart the sensor:
sudo systemctl restart imunifyai-sensor
Stop the sensor (turns off all monitoring on this host):
sudo systemctl stop imunifyai-sensor
Stopping the sensor disables every layer of system-call monitoring. The processes the sensor was watching keep running, but nothing on this host is enforcing policy until you start it again.
For deeper diagnostics and recovery, see the Sensor section.